
"Which metric should we be watching?"
So you've got twelve rates in a sheet. Thumbstop is up. Link CTR is down. Your boss wants one number by Friday.
Which one?
Which creative metrics actually matter?
The ones that move with your own first-party orders. A generic list from a blog post won't tell you. Check each rate against orders on your data, one at a time. Then fit a simple model on all of them together, because a lot of these rates overlap. That narrows twelve rates to three or four hypotheses. A test decides which ones cause sales.
The point is to pick metrics your own orders back up.
What rates can you measure from ad serving to sale?
Each rate is a step divided by the step before it. That way a weak step shows up where it happens.
| Stage | Rate | My formula |
|---|---|---|
| Platform | Thumbstop (often called hook rate) | 3-second plays ÷ impressions |
| Platform | Hold rate | ThruPlays ÷ 3-second plays |
| Platform | Engagement rate | engagements ÷ impressions |
| Platform | Link CTR | link clicks ÷ impressions |
| Bridge | Click-to-session | GA4 sessions ÷ link clicks |
| Site | Bounce rate | bounces ÷ sessions |
| Site | Scroll rate | 50% scrolls ÷ sessions |
| Site | On-page CTR | product clicks ÷ sessions |
| Site | Add-to-cart | add-to-carts ÷ product clicks |
| Site | Conversion | orders ÷ add-to-carts |
| Outcome | Orders per 1,000 impressions | first-party orders ÷ impressions × 1,000 |
Teams define these differently, so pick one definition, write it down and don't switch mid-trend. Hold rate only applies to video ads. For more on reading these rates, see creative performance analytics.
Click-to-session is the odd one. It's there to catch in-app previews counted as clicks. If it drops, check tracking before you blame the ad.
For the Meta field names behind each rate, see the Meta creative dashboard metrics.
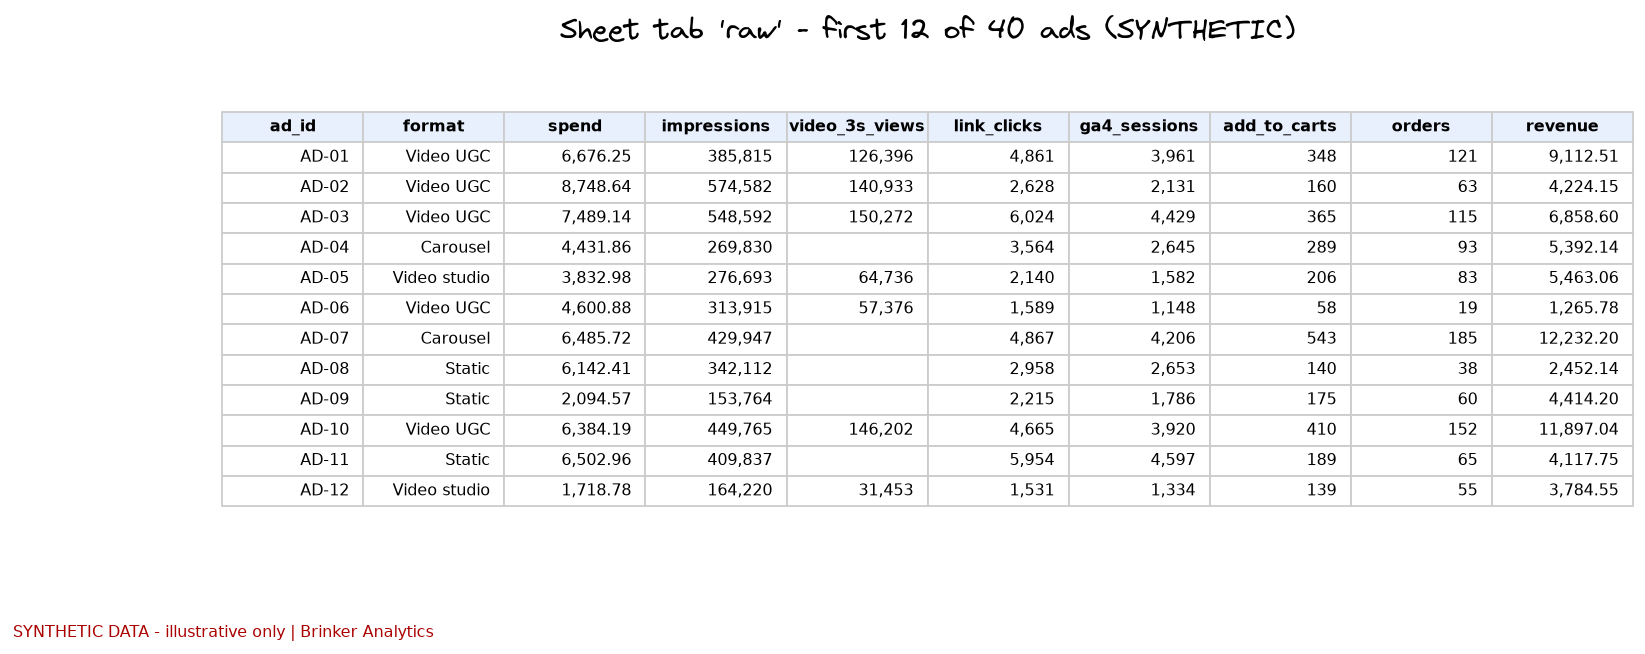
Want to see the math? Here's how the sample math works in the example sheet (simulated data, live formulas).
How do you find which metrics lead to orders?
Two passes.
Does each rate move with orders on its own?
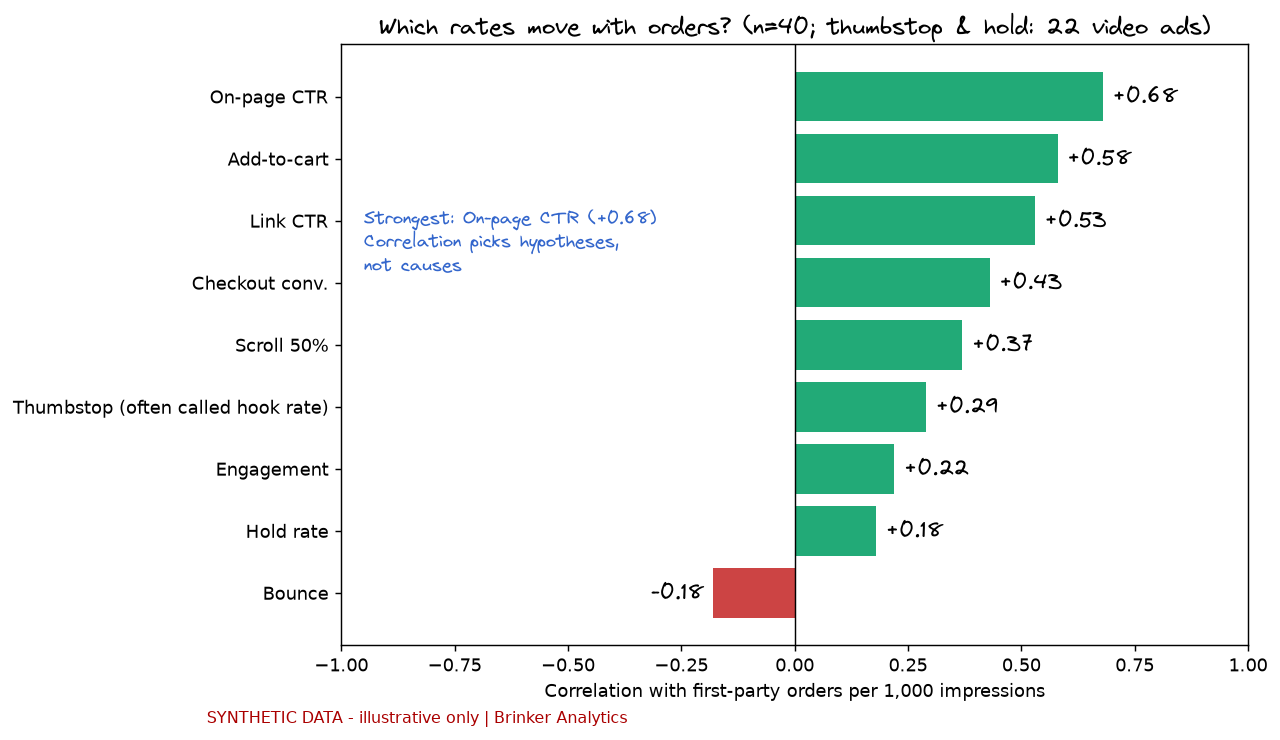
Run a correlation for each rate against orders per 1,000 impressions. A correlation runs from −1 to +1. Near zero means the two don't move together in a straight line.
Example (simulated data, 40 made-up ads): on-page CTR came in at +0.68, add-to-cart at +0.58 and link CTR at +0.53. Video metrics use only the 22 video ads (11 UGC, 11 studio); the 18 static and carousel ads are left out. Among those video ads, thumbstop came in at +0.29 and hold rate at +0.18.
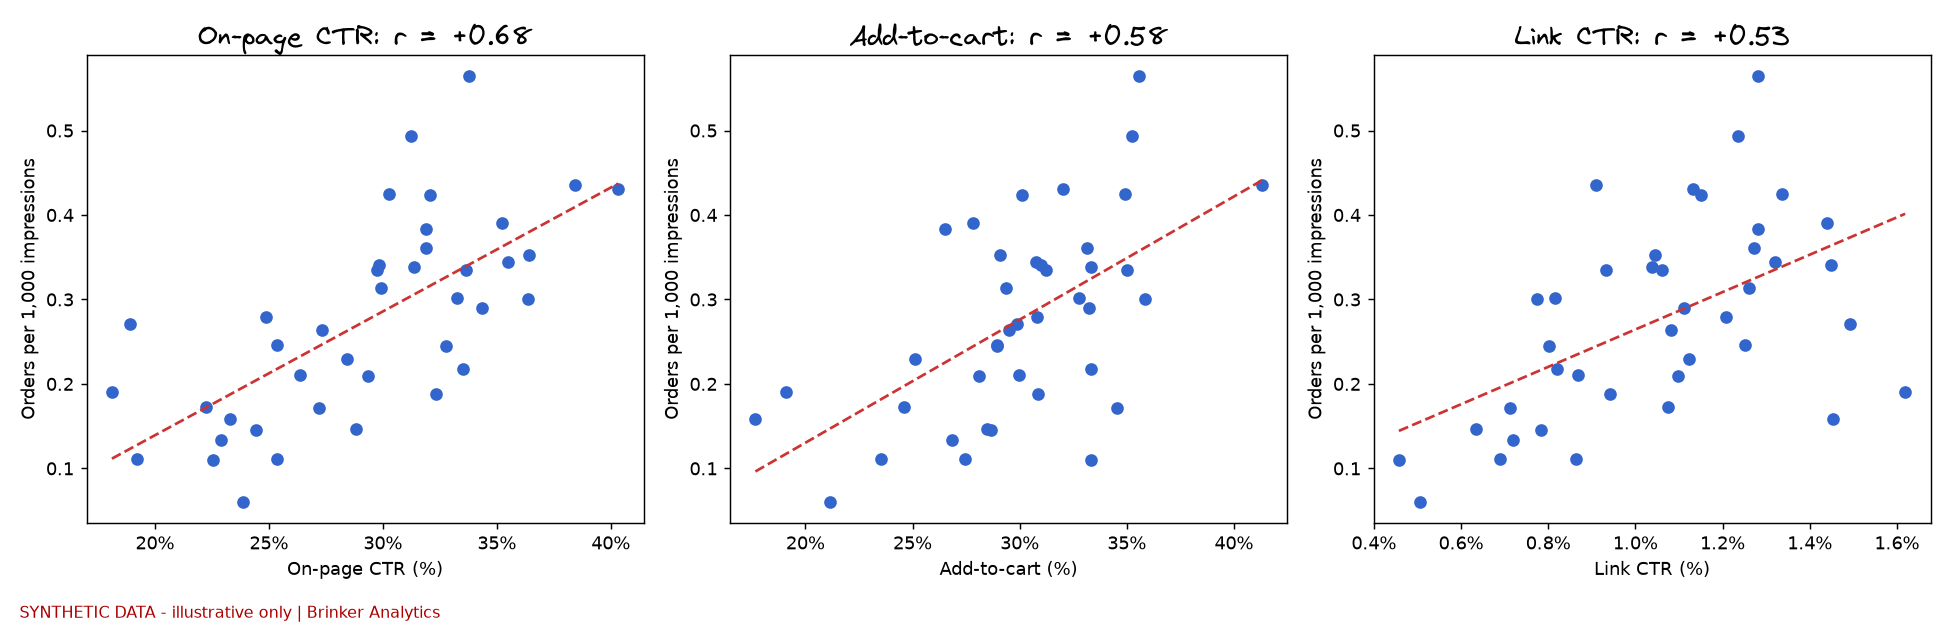
Look at the scatter plots, too. One unusual ad can make a correlation look strong.
Which ones still matter when you look at all of them together?
On-page CTR and add-to-cart tend to rise together. Look at them one at a time and both look great. But are they telling you two things, or one thing twice?
That's what ridge regression is for. It fits all the rates at once. It shrinks look-alike metrics so one doesn't take credit from the other.
Example (simulated data): the ridge model explained about 83% of the spread in orders in this sample (R² 0.83). Part of that is built in: these rates are steps in the same chain that ends in orders. With 40 ads and six inputs, expect a lower fit on new ads. It kept link CTR, on-page CTR and add-to-cart. Everything else shrank close to zero. Weights that small, like bounce at +0.002, are too small to tell apart from zero with 40 ads.
That's on simulated data. On your own data, have a statistician review the model before it drives a budget call.
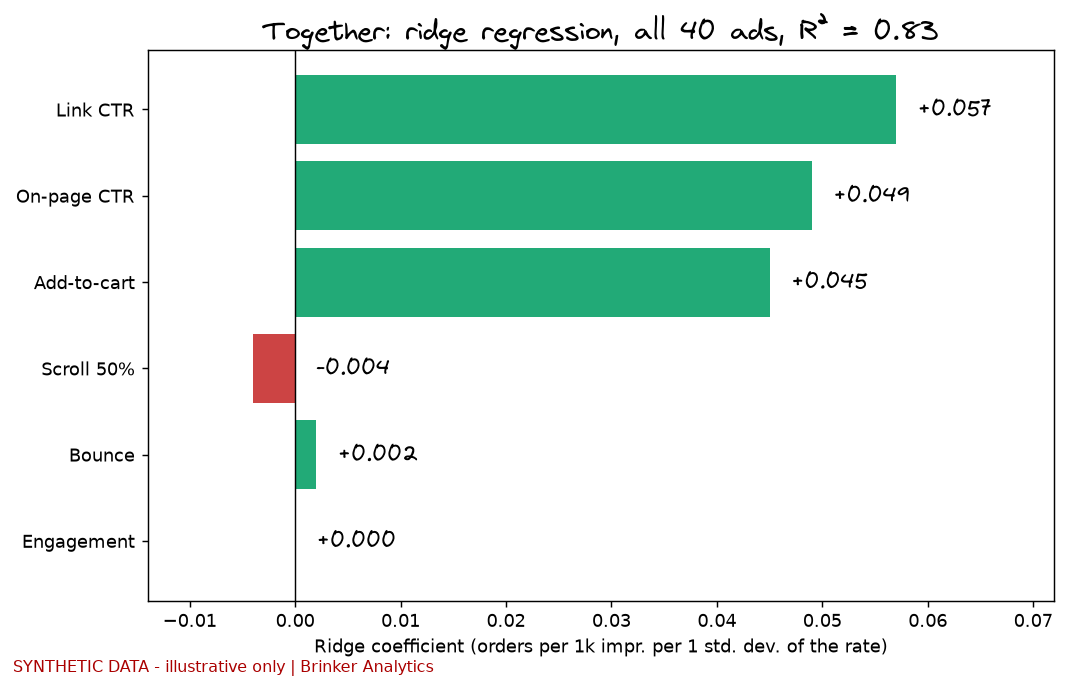
Where's thumbstop? It isn't in the model. It only exists for the 22 video ads, and the model needs a value for all 40. Among video ads it does move with orders (+0.29). With only 22 video ads, that's within noise. It's also less than the click and site rates. One possible reason: it measures attention, and the clicks sit closer to the order. Treat that as a hypothesis. On your data, thumbstop might be the first thing that matters.
How do you turn the winners into a short KPI list?
Keep three or four. Give each one a plain reason a media buyer would accept.
Example (simulated data):
- Link CTR: the ad earns the click.
- On-page CTR: the landing page matches what the ad promised.
- Add-to-cart: the offer holds up once people see the product.
Re-run it every quarter. Small samples swing, and a new format can change the list.
What is a creative strength score?
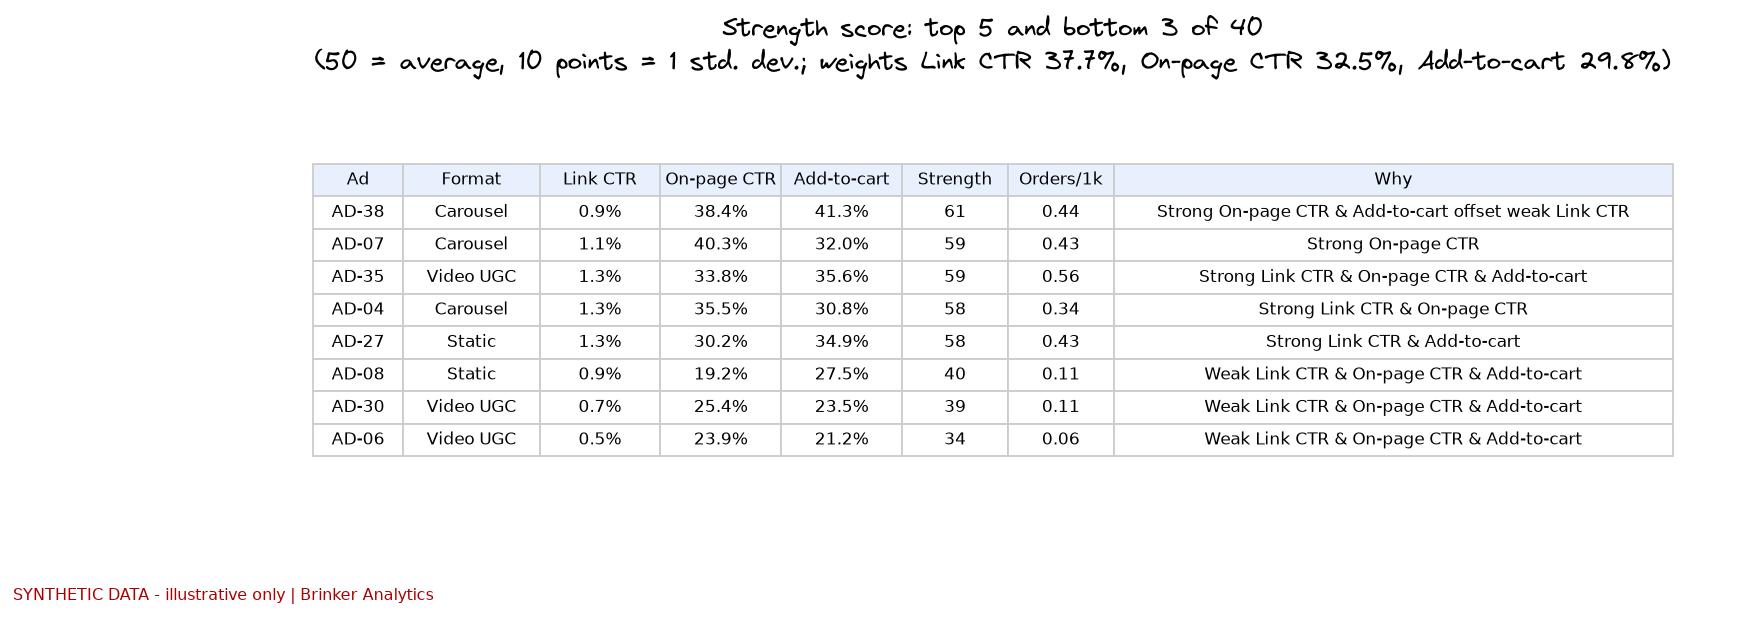
One number per ad, built from your short KPI list. 50 is average. Every 10 points is one standard deviation (a measure of the typical spread). It works like a T-score on a school test: 60 means one step above the typical ad, 40 means one step below.
How is it built? Turn each KPI into a z-score (how many standard deviations the ad sits from the average). Weight each one by its share of the ridge model's weight. Add them up, multiply by 10 and add 50.
Example (simulated data): the weights were link CTR 37.7%, on-page CTR 32.5% and add-to-cart 29.8%. AD-38's on-page CTR was 38.4% against an average of 29.3%, with a typical spread of 5.4 points. That's about +1.691 standard deviations. Its add-to-cart sat about +2.456 and its link CTR about −0.512. Weighted, that's about +1.09. And 50 + 10 × 1.09 ≈ 60.9, which rounds to 61.
The score needs a sentence beside it, or nobody trusts it. Like this:
AD-38's strong on-page CTR and add-to-cart offset its weak link CTR, for a strength of 61.
Does a high correlation mean the ad caused the sale?
No.
Correlation picks the hypotheses. A creative test decides cause. For the channel itself, that's a geo or lift test. Check whether your data can support a geo test, then run a power check before you spend. The incrementality testing page covers how I run them.
And keep this in mind: last click undervalues upper-funnel channels. An upper-funnel video can score low here and still add sales. The score only sees clicks and site visits, so it misses sales that come without a click.
No model owns the truth, and that includes this one.
How do you automate it into an email or Slack digest?
Once the sheet works, schedule it.
- Pull Meta delivery, GA4 sessions and first-party orders into the sheet each week.
- Have a scheduled script recompute the rates, the KPI list and the strength scores.
- Post a short digest: the top and bottom ads, the "why" sentence for each, this week's KPIs, and a reminder that these are patterns to test.
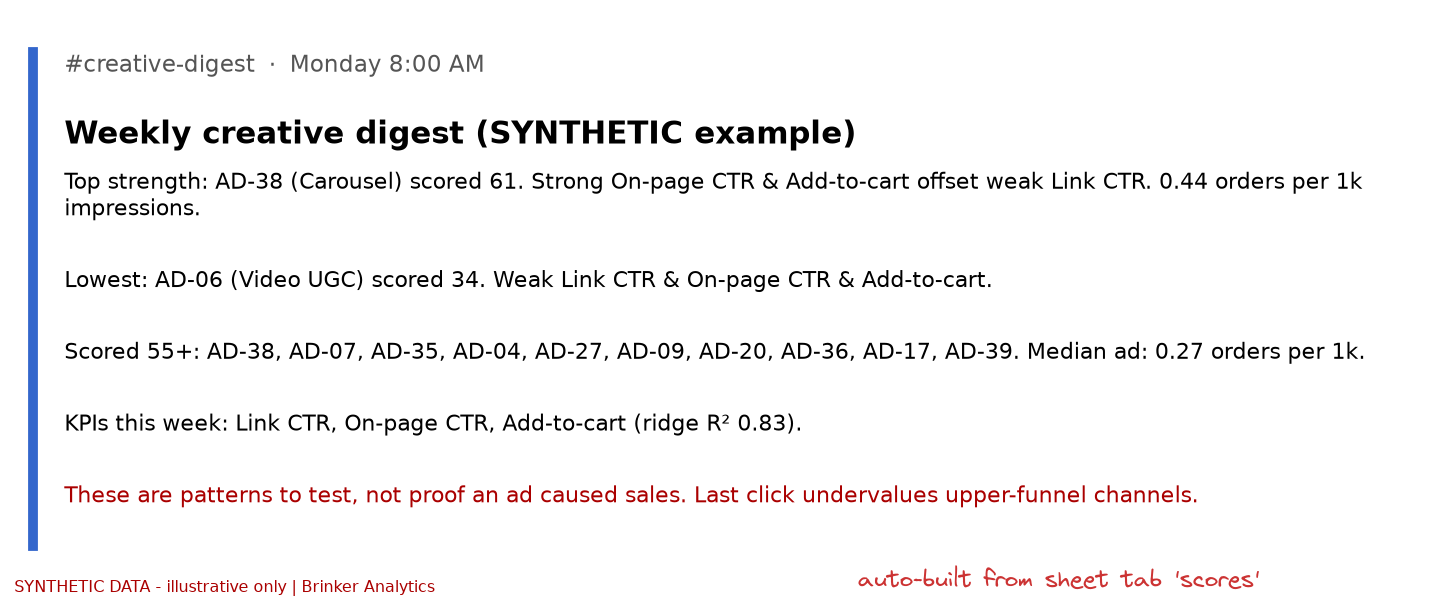
You can go one step further and line up each ad's post copy, comments and media with these scores. The Meta creative dashboard shows how to build that row, with an LLM's notes beside it.
Keep that last reminder line. It stops someone from pausing an ad because of a correlation.
Want this built on your own order data?
If you want the KPI shortlist built on your own orders, bring your channels to a first conversation. See if we're a fit.
FAQs
How many ads do I need before correlation means anything?
As a rough guide, 30 or more ads with real spend. Fewer than that and one ad can swing the result. Treat the output as uncertain either way.
Should I use CPC or CPV as a creative KPI?
No. Cost mixes the auction in. When CPC moves, you can't tell how much is the audience and how much is bidding. Use rates per impression.
Why ridge regression instead of plain correlation?
Because creative rates overlap. Correlation checks one rate at a time, so two look-alike rates both look strong. Ridge fits them together and shrinks the overlap.
How often should I re-pick my KPIs?
Every quarter, or sooner after a big format or offer change.